OP-ED
Civilworks New England ( CNE ) has been evaluating the rate of sea level at many long record global tide gauges , including New England tide data . We find that the rate of sea level rise , over a 19-year tidal epoch rolling window , varies over time . This variation in rate of sea level rise and fall has similar trends at regional tide stations and those cyclical trends have strong correlations to natural cycles , including the roughly 60- year cycle in sea surface temperature anomalies ( Atlantic Multidecadal Oscillation ( AMO )
AMO ), variation in the Length Of Day ( LOD , variation in the spin rate of Earth
LOD ) and to the eccentricity of Jupiter ’ s orbit , which has been tied to increases in space dust entering our atmosphere , cloud cover and climate
Jupiter , see Figure 3 .
Figure 3 Rates of Sea Level Rise at New England NOAA Tide Stations and reference climate indices ( monthly means , rate using a 19-year rolling window , plotted at 3 year lag )
The long record tide stations had high rates of sea level rise around 1950 ( AMO warm phase ), followed by low negative rates of sea level rise in the mid 1060 ’ s and mid 1980 ’ s ( AMO cold phase and an increase in river flows mid 1970 ’ s ) and are currently back to a higher rate of sea level rise ( AMO warm phase ). With the AMO expected to return to a cold phase in less than 10 years , decreasing rates of sea level rise are expected with the next low rates around 2040 if the correlation holds . Over the last 11 years the rate of sea level rise has been negative , however this is not a full tidal epoch ( 19 years ). The Portland long term trend of 0.6 ft / 100 yrs is a more reasonable expectation of longer term sea level rise with a tight confidence interval .
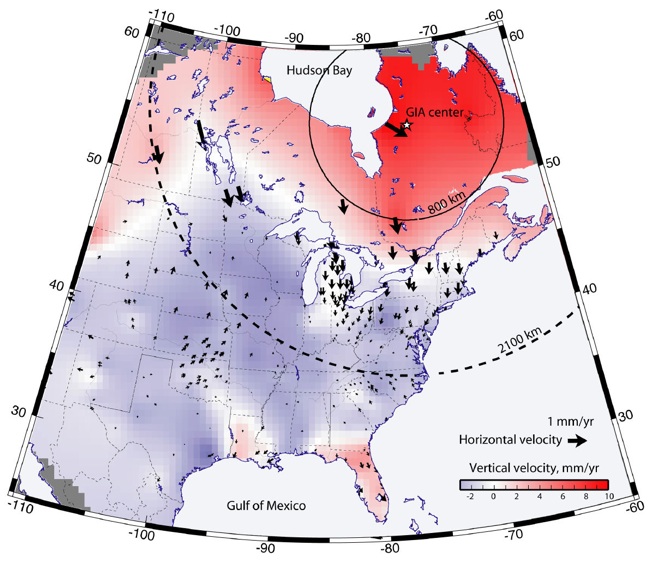
Vertical Land Movement :
The rate of sea level rise to an observer on the shoreline , termed relative sea level rise is often different from the global rate of sea level rise . The land has vertical movement , which can include soil subsidence and bedrock ( earth crust ) movement and this does increase or decrease the apparent sea level rise trend at the local shoreline . Canada , Alaska and Scandinavia have strong post-glacial rebound with the earth ’ s crust rising since the end of the last ice age , resulting in an apparent dropping of mean sea level ,
rebound . The crustal rebound extends into south into Maine and is fairly neutral to slightly upward land movement in New Hampshire . Moving farther south into southern Massachusetts the crustal movement becomes slightly downward . Connecticut and south typically has about 0.65 ft / 100 yrs of crustal sinking , causing higher relative sea level rise ,
east coast rebound .
Soil subsidence can also be a significant factor and is a strong contributor to higher apparent rates of sea level rise in the mid-Atlantic shoreline . Soil subsidence can also be quite localized . For example , much of the shoreline in Boston is filled land on deep soft clay . NOAA estimates the Boston tide gauge is sinking 0.28 ft / 100 yrs , causing a higher apparent rate of sea level rise , which is not representative of New Hampshire . For the NH Seacoast area , in New Castle and Portsmouth , the Continuously Operating
9